What's new in Chrome DevTools 2019


I like What’s new in Chrome DevTools session in Google I/O to catch up latest updates!
But unfortunately there was not that session in Google I/O 2019… so that I made it by myself !
Let’s get started!
JavaScript
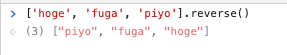
Eager Evaluation (v68) [watch on youtube]
There is Eager evaluation option in Settings in console panel. You can see result before execution if you turn it ON.
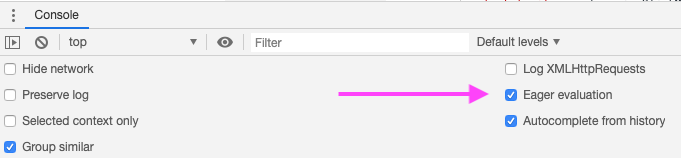
It might be useful when you write regular expression.
This feature can be used in Canary version before but now everyone can use it in standard version of Chrome.
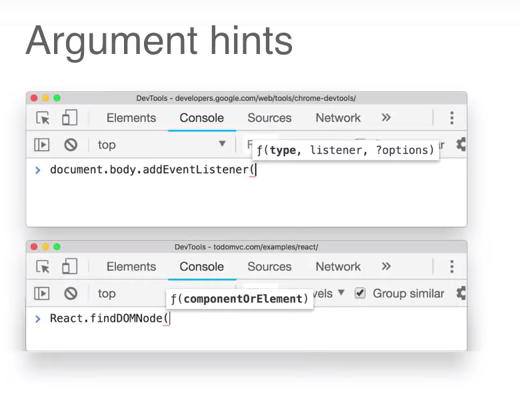
Argument Hints (v68) [watch on youtube]
Funcnton parameter hints is shown in console panel while you typing.
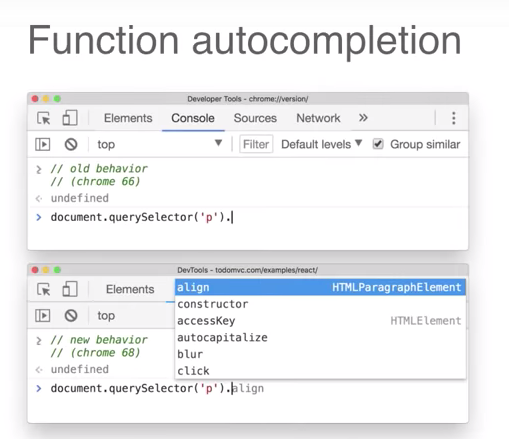
Autocomplete After Invoking Functions (v68) [watch on youtube]
Autocomplete is shown for function return value.
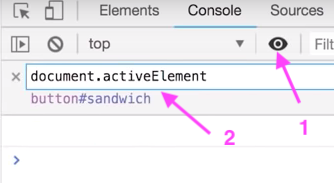
Live Expressions in the console (v70) [watch on youtube]
You can set Live Expression statement in console panel.
In this case activeElement will be change eveytime you change focus element.
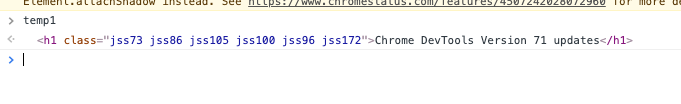
Store DOM nodes as global variables (v71) [watch on youtube]
You can set the element as javascript global variable by selecting Store as global variable in context menu.
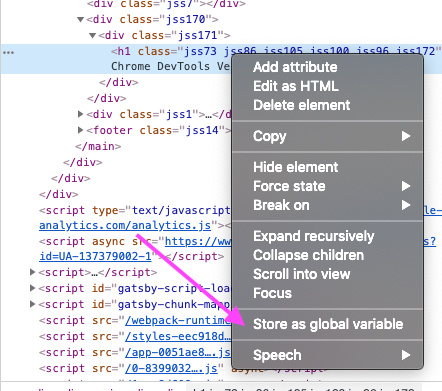
The element will be set as temp${N}.
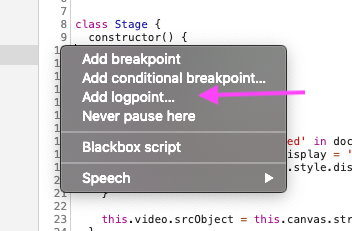
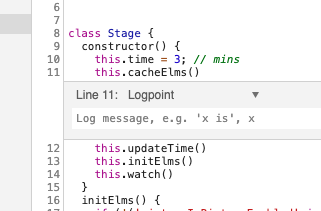
Logpoint (v73) [watch on youtube]
Common debugging pattern for Front-end developer is write console.log -> execute javascript -> remove console.log.
Now you don’t need to edit code for it!!
You can put logpoint to statement in source panel.
Element
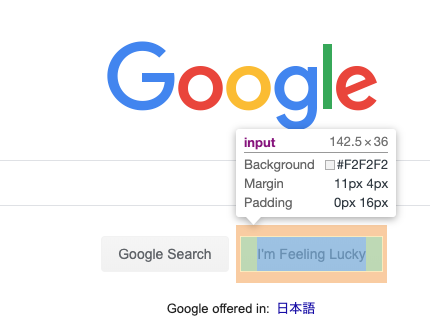
Detailed tooltips when inspecting nodes (v73) [watch on youtube]
The detail of element is shown when you select it in element panel.
AAA contrast ratio line in the Color Picker (v73) [watch on youtube]
You can check current Contrast ratio and recommendation for it.
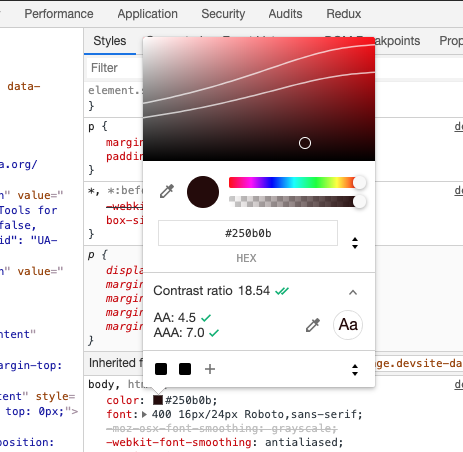
You can check for more detail about Contrast ratio.
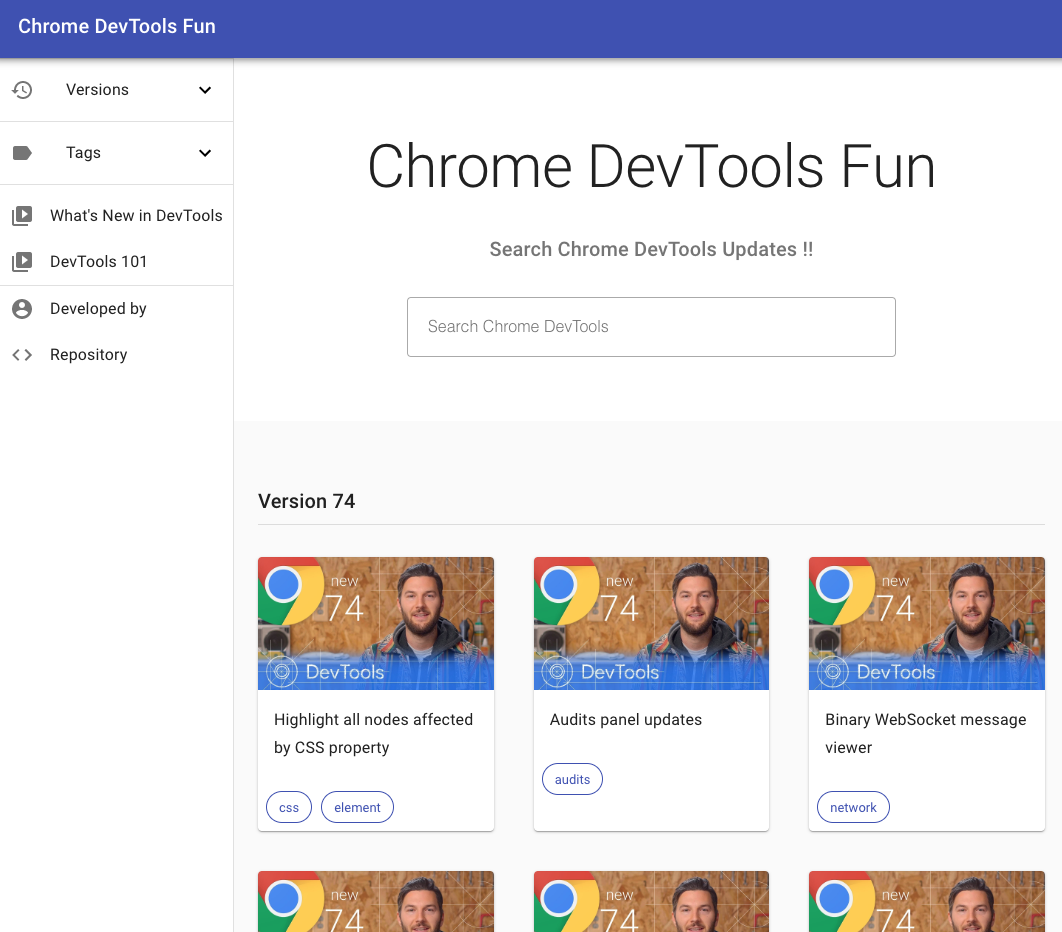
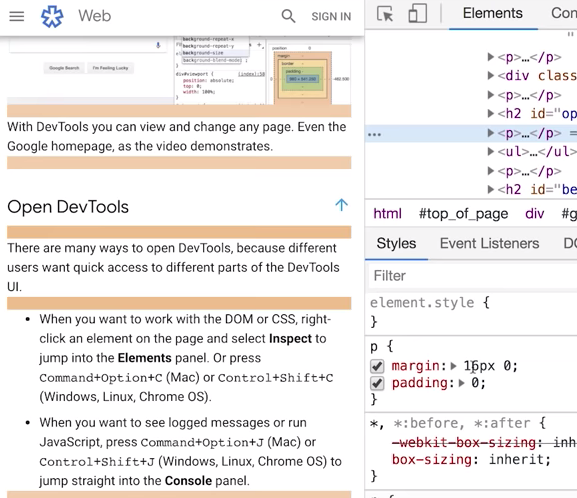
Highlight all nodes affected by CSS property (v74) [watch on youtube]
When you edit css property the elements which same css property apply to will be highlighted.
The margin in p elements are highlighted while editing that css property in this case.
Performance
Performance metrics in the Timings section (v72) [watch on youtube]
You can check performance metrics such as First Pain, First Contentful Paint in Network panel.
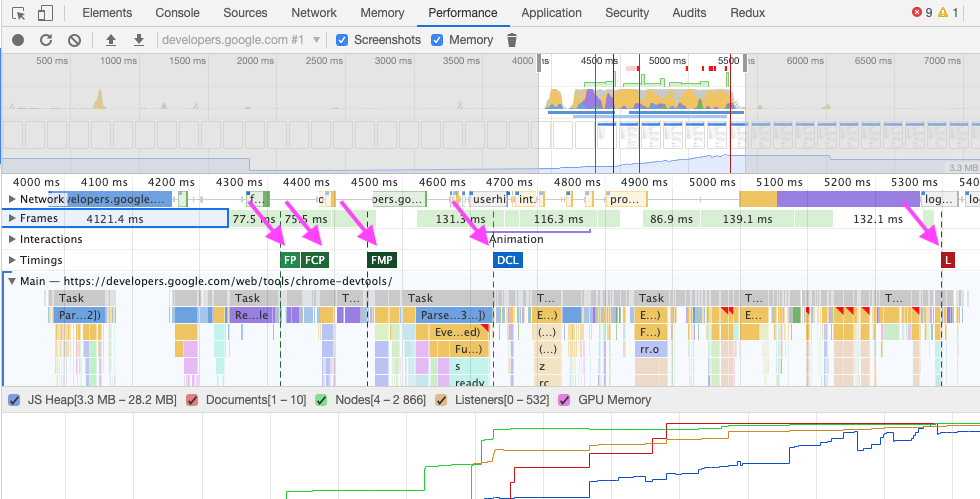
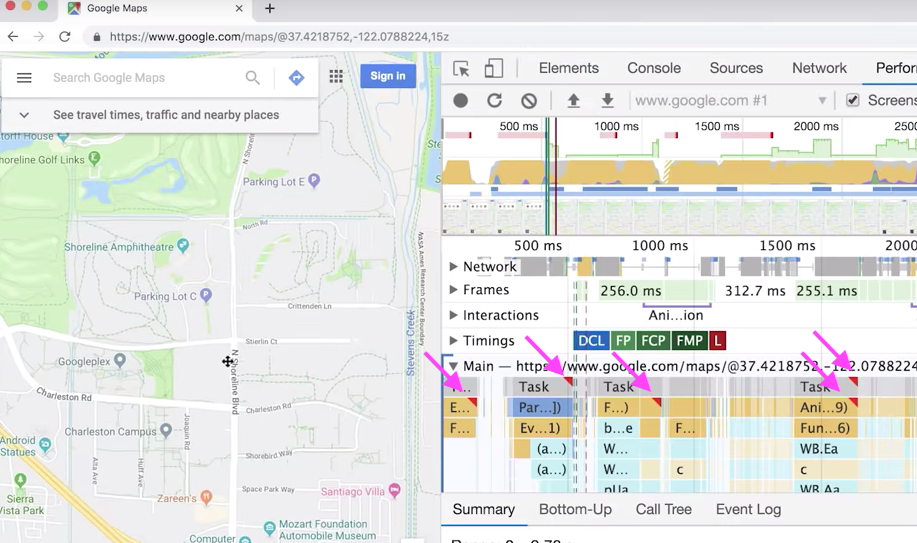
Long tasks in performance recordings (v74) [watch on youtube]
You can see Long Task in Network panel.
The tasks have red triangle label at upper right.
In the end
There are bunch of updates!
Thank you for best effort of ChromeDevtools team!!!!
I made site where you can check all updates by version basis or feature basis.
Check it out !!